Working With Charts
Introduction
This tip says how to formulate our data as a High Chart. Please provide your valuable comments. 🙂
Background
I am working in a project where 80% of the processes are handled in the client side itself. So I was looking for a client-side chart and High Chart satisfied my requiremetns. It is a good plugin and also easy to use. What is High Chart? High Charts is solely based on native browser technologies and doesn’t require client-side plugins like Flash or Java. Furthermore you don’t need to install anything on your server. No PHP or ASP.NET. High Charts needs only two JavaScript files to run, the highcharts.js core and either the jQuery, MooTools, Prototype or High Charts Standalone framework. The High Charts Standalone framework is designed for those who do not already use jQuery, MooTools or Prototype in their web page and wish to use High Charts with minimal overhead. Read more here: HIGHCHARTS, HIGHSTOCK AND HIGHMAPS DOCUMENTATION.
What you must know
- jQuery :jQuery .
- JavaScript :W3Schools.com.
- CSS 3 : CSS3 Introduction .
- HTML :HTML(5) Tutorial .
- DOM Manipulations in jQuery :jQuery – DOM Manipulation .
Before you start, you need to download the necessary files from: http://www.highcharts.com/download. Once you download the files, you need to include those in your project. Or you can use the CDN also.
[js]
<script src=“http://code.highcharts.com/highcharts.js”></script>
<script src=“http://code.highcharts.com/modules/heatmap.js”></script>
<script src=“http://code.highcharts.com/modules/exporting.js”></script>
[/js]
Now it is time to add a UI element in which we will generate the chart. Please assign some width to that element, so that our chart can be formulated inside that element.
[html]
<div id=“container” style=“height: 400px; min-width: 310px; max-width: 800px; margin: 0 auto”></div>
[/html]
Now what else is pending is only to add the script that does the formulation work as in the following:
[js]
$(function() {
$(‘#container’).highcharts({
chart: {
type: ‘heatmap’,
marginTop: 40,
marginBottom: 40
},
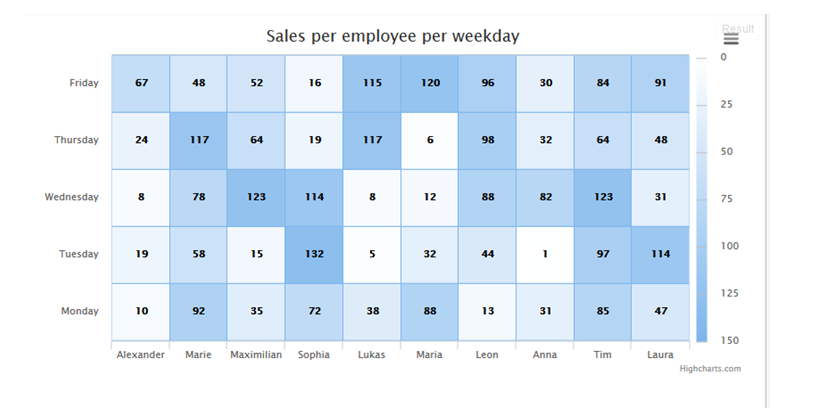
title: {
text: ‘Sales per employee per weekday’
},
xAxis: {
categories: [‘Alexander’, ‘Marie’, ‘Maximilian’, ‘Sophia’, ‘Lukas’, ‘Maria’, ‘Leon’, ‘Anna’, ‘Tim’, ‘Laura’]
},
yAxis: {
categories: [‘Monday’, ‘Tuesday’, ‘Wednesday’, ‘Thursday’, ‘Friday’],
title: null
},
colorAxis: {
min: 0,
minColor: ‘#FFFFFF’,
maxColor: Highcharts.getOptions().colors[0]
},
legend: {
align: ‘right’,
layout: ‘vertical’,
margin: 0,
verticalAlign: ‘top’,
y: 25,
symbolHeight: 320
},
tooltip: {
formatter: function() {
return ‘<b>’
this.series.xAxis.categories[this.point.x]
‘</b> sold <br><b>’
this.point.value ‘</b> items on <br><b>’
this.series.yAxis.categories[this.point.y]
‘</b>’;
}
},
series: [{
name: ‘Sales per employee’,
borderWidth: 1,
data: [
[0, 0, 10],
[0, 1, 19],
[0, 2, 8],
[0, 3, 24],
[0, 4, 67],
[1, 0, 92],
[1, 1, 58],
[1, 2, 78],
[1, 3, 117],
[1, 4, 48],
[2, 0, 35],
[2, 1, 15],
[2, 2, 123],
[2, 3, 64],
[2, 4, 52],
[3, 0, 72],
[3, 1, 132],
[3, 2, 114],
[3, 3, 19],
[3, 4, 16],
[4, 0, 38],
[4, 1, 5],
[4, 2, 8],
[4, 3, 117],
[4, 4, 115],
[5, 0, 88],
[5, 1, 32],
[5, 2, 12],
[5, 3, 6],
[5, 4, 120],
[6, 0, 13],
[6, 1, 44],
[6, 2, 88],
[6, 3, 98],
[6, 4, 96],
[7, 0, 31],
[7, 1, 1],
[7, 2, 82],
[7, 3, 32],
[7, 4, 30],
[8, 0, 85],
[8, 1, 97],
[8, 2, 123],
[8, 3, 64],
[8, 4, 84],
[9, 0, 47],
[9, 1, 114],
[9, 2, 31],
[9, 3, 48],
[9, 4, 91]
],
dataLabels: {
enabled: true,
color: ‘black’,
style: {
textShadow: ‘none’,
HcTextStroke: null
}
}
}]
});
});
[/js]
Explanation
Now it’s time to go deeper to see what we have done. There are a few properties we have set for our chat so far. The following are what they are:
- Chart: This property sets the chart type and chart styles. Here in this I am using heatmap. And you can set your own style to it.
- Title: This sets the title for our chart. You can set a meaningful title related to our chart.
- XAxis: Here you need to bind the series of elements that all you need to come under in X axis. You can bind that to the inner property categories.
- YAxis: Here you need to bind the series of elements that all you need to come under in Y axis. You can bind that to the inner property categories.
- ColorAxis: This property sets the colors for the chart. You can set the min color and max color so that we can get the shadow effect.
- Legend: This is where we can set the limitation of which quadrant we need to show the data. You can set the y value to get the values as it’s multiplied one. You can also set its alignment.
- Tooltip: Tooltip plays a main role in this chart, when you mouse over to the specific column you can see the small pop up that shows the exact value. You can set your own style for this J
- Series: Now it’s time to apply the data. This is where we need to do that.
Output
Points of Interest
jQuery, CSS, HTML and HighChart.
History
1st Version: 08-May-2015