Client Side Chart Widget in HTML5: Part 6 (Radar Chart)
Introduction
I hope you have read my first two articles in this series that explains the loading of Bar Charts, Pie Charts, Line Charts, Doughnut Charts and Polar Area Charts. Please see the following links.
- Client-Side Chart Widget in HTML 5: Part 1 (Bar Chart)
- Client-Side Chart Widget in HTML 5: Part 2 (Pie Chart)
- Client-Side Chart Widget in HTML 5: Part 3 (Line Chart)
- Client-Side Chart Widget in HTML5: Part 4 (Doughnut Chart)
- Client-Side Chart Widget in HTML5: Part 5 (Polar Area Chart)
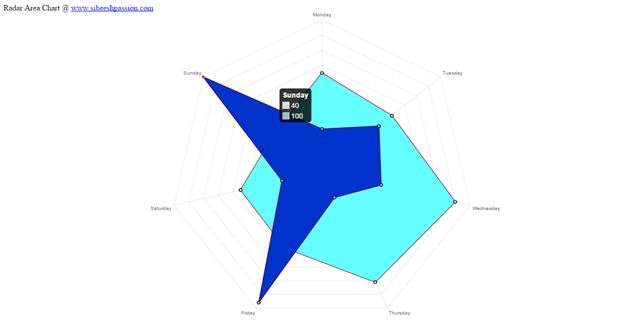
Now we will explain a client Radar Chart widget in HTML5.
Background
Please download the necessary files here http://www.chartjs.org/.
Using the code
A simple HTML
- <!DOCTYPE html>
- <html xmlns=“http://www.w3.org/1999/xhtml”>
- <head>
- <title> Radar Chart Using Chart.js</title>
- </head>
- <body></body>
- </html>
Included JavaScript file
- <script src=“Chart.js”></script>
Call the Chart Function
- window.onload = function () {
- var canvasObject = document.getElementById(“myChart”).getContext(“2d”);
- window.myRadar = new Chart(canvasObject).Radar(radarChartData, {
- responsive: true
- });
- }
Here we are loading the chart in the myChart.
As you can see in the preceding code, radarChartData is the data we will load into the chart.
- var radarChartData = {
- labels: [“Monday”, “Tuesday”, “Wednesday”, “Thursday”, “Friday”, “Saturday”, “Sunday”],
- datasets: [
- {
- label: “Dataset 1”,
- fillColor: “#66FFFF”,
- strokeColor: “#800000”,
- pointColor: “rgba(220,220,220,1)”,
- pointStrokeColor: “#000”,
- pointHighlightFill: “#FF1919”,
- pointHighlightStroke: “rgba(220,220,220,1)”,
- data: [65, 59, 90, 81, 56, 55, 40]
- },
- {
- label: “Dataset 2”,
- fillColor: “#0033CC”,
- strokeColor: “#800000”,
- pointColor: “rgba(151,187,205,1)”,
- pointStrokeColor: “#000”,
- pointHighlightFill: “#FF1919”,
- pointHighlightStroke: “rgba(151,187,205,1)”,
- data: [28, 48, 40, 19, 96, 27, 100]
- }
- ]
- };
Properties
- Labels
- Datasets
- label ( label for your dataset)
- fillColor
- strokeColor
- pointColor
- pointStrokeColor
- pointHighlightFill
- pointHighlightStroke
- data
Here you can change the properties as you want.
Complete HTML
- <!DOCTYPE html>
- <html xmlns=“http://www.w3.org/1999/xhtml”>
- <head>
- <title>Radar Chart Using Chart.js</title>
- <script src=“Chart.js”></script>
- <script>
- var radarChartData = {
- labels: [“Monday”, “Tuesday”, “Wednesday”, “Thursday”, “Friday”, “Saturday”, “Sunday”],
- datasets: [
- {
- label: “Dataset 1”,
- fillColor: “#66FFFF”,
- strokeColor: “#800000”,
- pointColor: “rgba(220,220,220,1)”,
- pointStrokeColor: “#000”,
- pointHighlightFill: “#FF1919”,
- pointHighlightStroke: “rgba(220,220,220,1)”,
- data: [65, 59, 90, 81, 56, 55, 40]
- },
- {
- label: “Dataset 2”,
- fillColor: “#0033CC”,
- strokeColor: “#800000”,
- pointColor: “rgba(151,187,205,1)”,
- pointStrokeColor: “#000”,
- pointHighlightFill: “#FF1919”,
- pointHighlightStroke: “rgba(151,187,205,1)”,
- data: [28, 48, 40, 19, 96, 27, 100]
- }
- ]
- };
- window.onload = function () {
- var canvasObject = document.getElementById(“myChart”).getContext(“2d”);
- window.myRadar = new Chart(canvasObject).Radar(radarChartData, {
- responsive: true
- });
- }
- </script>
- </head>
- <body>
- <div>
- Radar Area Chart @ <a href=“www.sibeeshpassion.com”>www.sibeeshpassion.com</a>
- <canvas id=“myChart”></canvas>
- </div>
- </body>
- </html>
Conclusion
I hope you can now create your own chart.
Output


